
Trends and ranges
Markets can only do two things: range bound or trend. That means that whether they are trapped in a smaller zone going up and down without breaking this zone, or they can trend, meaning they go constantly in the same direction, further and further: higher and higher or lower and lower.
However, markets don’t go in a straight line. They tend to move a bit in one direction then retrace and then a bit further, then abruptly in one direction, then pause again, retrace a bit, and so on. Sometimes the movement can seem random, but if you see it from a longer time frame, things can get much clearer.
A Bullish trend is when the market goes higher and higher, making higher highs and higher lows.
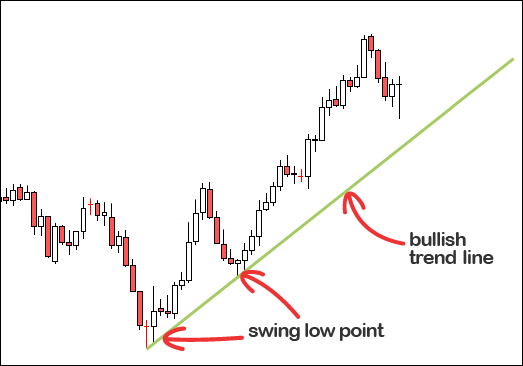
A Bearish trend is when the market goes lower and lower, making lower highs and lower lows.

Support and Resistance
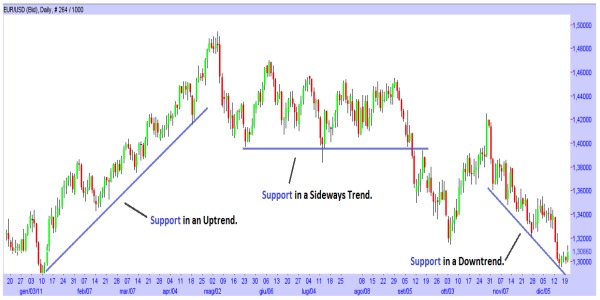
Support is a horizontal line, the “floor” where price action appears to stop and rebound higher or stay around it for some time without crossing it in a definitive way, making it a psychological barrier for traders. Thus, it is something significant when it’s finally broken.
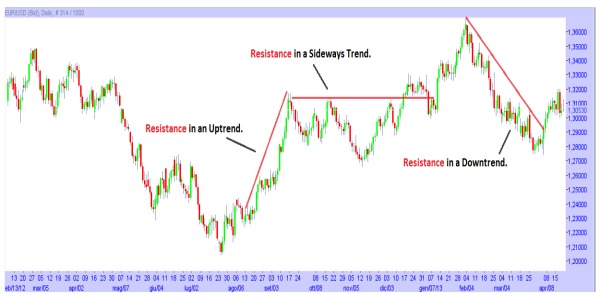
Resistance is a horizontal line, the “roof” where price action appears to stop and rebound lower or stay around it for some time without crossing it in a definitive way, making it a psychological barrier for traders. Thus, it is something significant when it’s finally broken.
When a Support zone is finally broken and price moves definitely lower, this former support normally becomes resistance.
When a Resistance zone is finally broken and price moves definitely higher, this former resistance normally becomes support.
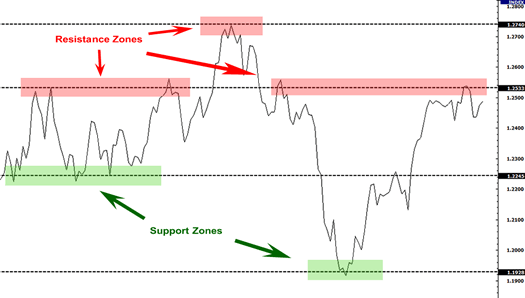
Don’t worry if you don’t know exactly where to place support and resistance, every trader place them a bit different, they should be taken more like zones than exact points.
In all my trading strategies, I never plot support and resistance in lower time frames; the most useful are daily and weekly, they are the most significant and thus the easier to use for technical trading.
To plot resistance in a 1-hour chart or 4-hour chart, in my opinion, is useless because the bigger money (banks, hedge funds) don’t move real money in the lower time frames, and they are the ones really making and affecting the markets.
